
A red mobile score in Google PageSpeed Insights feels worse than it should.
Your site may load fine on your laptop. The homepage may look polished. The forms may work. Then PageSpeed Insights gives the mobile version a 38, and the report lists twenty problems in language only a developer wants to read.
That moment is common for law firms, financial advisors, accountants, and local service companies. We see it during audits all the time. The site was designed for brand trust, but the browser has to fight through oversized images, stacked tracking scripts, and page builder code before a visitor can even tap the call button.
Google Page Speed Insights & Core Web Vitals Analysis helps you separate what looks slow from what actually hurts search visibility and lead flow.
In this blog post, you will learn what PageSpeed Insights measures, how Core Web Vitals work, and which fixes usually move mobile pages from red to green fastest.
Start with the data source. Because that’s where most teams misread the report.
What Does Google PageSpeed Insights Actually Measure?
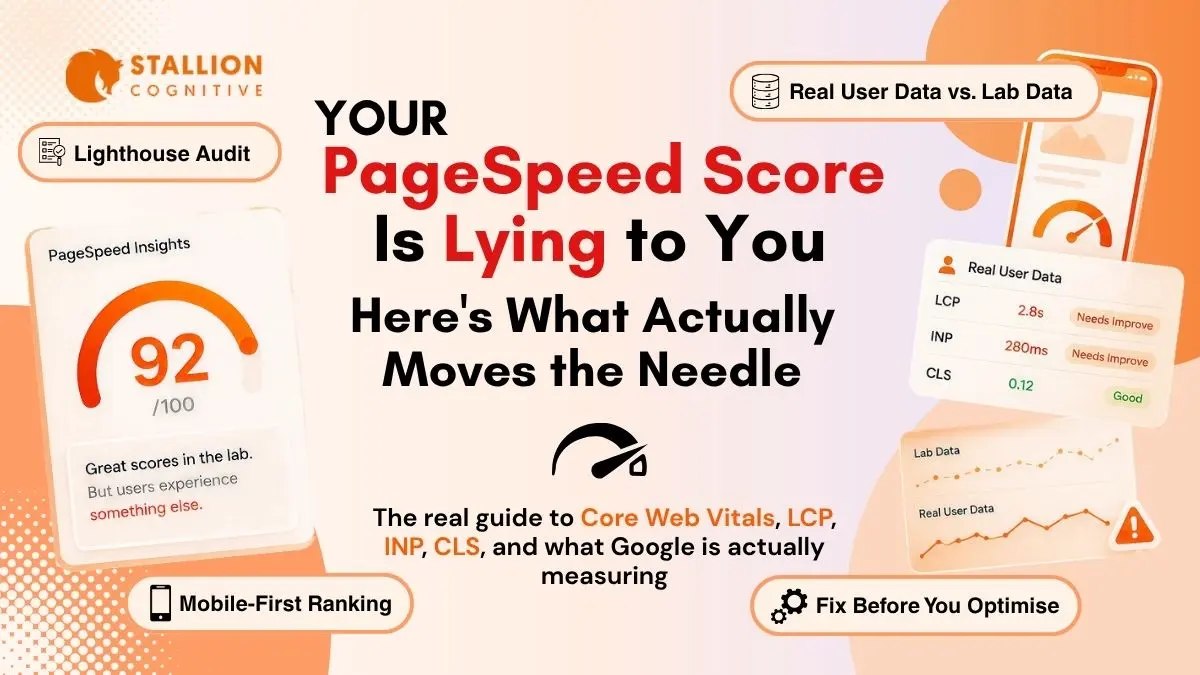
Google PageSpeed Insights measures a single URL with two different views of performance. Lighthouse lab data simulates one controlled page load, while Chrome User Experience Report field data shows how real Chrome visitors experienced the page over the previous 28-day collection period. Field data is the part tied to real user experience.
The tool puts those two views beside each other, which is useful and confusing at the same time.
Think of Lighthouse as a practice run. It loads the page under a fixed test setup so you can debug what changed after compressing an image or delaying a script. CrUX field data is closer to a month of customer footage. It includes weak phones, slow connections, cached visits, and the real mess of the open web.
| PageSpeed panel | What it tells you | Best use |
| Field data | How real visitors experienced the page | SEO and Core Web Vitals pass or fail |
| Lab data | What happened in one controlled test | Debugging and retesting fixes |
| Origin data | Site-wide performance when URL data is thin | Smaller sites and newer pages |
For example, if you are running a campaign on local SEO for advisors, origin data is common on lower-traffic service pages. That does not mean the report is broken. It means Google needs enough real Chrome visits before it can show page-level field data.
But the thing is
If lab data is green and field data is red, trust the field data first. That is the version closest to your visitors.
How Does the PageSpeed Insights Score Work?
The PageSpeed Insights performance score is a Lighthouse lab score from 0 to 100. It comes from weighted performance metrics rather than every recommendation in the report. Chrome’s Lighthouse documentation explains that more heavily weighted metrics affect the score more, and that scores can fluctuate because of test conditions.
That means the big red number is a useful clue. It is not the full diagnosis.
| Metric | What it means in plain English | Common service-site cause |
| LCP | Main content appears too late | Hero image, slow server, blocked CSS |
| TBT | Browser is too busy to respond | Heavy scripts and page builders |
| CLS | Page jumps while loading | Missing image sizes or late banners |
| FCP | First visible content appears | Render-blocking CSS or fonts |
| Speed Index | Page fills in visually | Large layout and image payloads |
A law firm homepage can score 92 on desktop and 41 on mobile with the same code. The desktop test gets stronger hardware. The mobile test exposes the kind of device many real searchers actually use.
You have to be cautious.
Do not spend hours moving a score from 94 to 98 while your contact page sits at 43 on mobile. Fix the page that brings leads first.
Core Web Vitals Analysis for Dummies
Core Web Vitals analysis checks whether a page feels fast, responsive, and stable for real users. Google evaluates Largest Contentful Paint, Interaction to Next Paint, and Cumulative Layout Shift against published thresholds. A page needs good results across all three to pass the assessment.
Strip away the acronyms and the test becomes easier to understand.
“If the page loads late, reacts late, or jumps while someone taps, it is failing a human moment.”
| Core Web Vital | Good score | What the visitor feels |
| LCP | 2.5 seconds or faster | “The main page is here.” |
| INP | 200 milliseconds or faster | “The button reacted.” |
| CLS | 0.1 or lower | “The layout stayed still.” |
LCP usually fails first on WordPress sites. In the 2025 Web Almanac, 62% of mobile pages achieved good LCP, 77% achieved good INP, 81% achieved good CLS, and 48% passed all three Core Web Vitals on mobile.
For local SEO for accountants, that matters because many visitors arrive with urgency. They need tax help, bookkeeping support, or a quick answer before choosing who to call. A slow first impression quietly hands that lead to someone else.
Now the metric names have a job.
LCP tells you what loads slowly.
INP tells you what reacts slowly.
CLS tells you what moves when it should stay put.
Why Mobile PageSpeed Changes SEO Outcomes
Mobile PageSpeed changes SEO outcomes because Google uses the mobile version of a site’s content for indexing and ranking. A fast desktop site cannot protect a slow mobile experience. The mobile version is the version Google’s systems primarily evaluate.
That is uncomfortable for teams that approve designs on large monitors.
The mobile version carries different constraints:
- Weaker processors: A phone takes longer to parse the same JavaScript bundle your office laptop handles easily.
- Unforgiving viewports: A desktop hero image often gets resized visually while the original file still downloads.
- Shared main thread: Chat widgets, tracking pixels, form tools, and menu scripts all compete for the same mobile processing time.
We see this pattern often in local SEO ranking factors audits. The content is competitive. The Google Business Profile is solid. The mobile experience is the weak link.
A visitor does not separate “SEO issue” from “website issue.” If the tap-to-call button lags, they feel doubt. If the page jumps, they lose trust. If the hero takes four seconds, they may never read your headline.
How to Run a Page Speed Analysis Without Guesswork
A strong page speed analysis checks Search Console, PageSpeed Insights, and browser-level diagnostics before changing code. Start with the pages that create leads, then trace the failing metric back to the file, script, template, or hosting issue causing it.
Use this sequence before touching plugins:
- Open Search Console first
Check the Core Web Vitals report on mobile. Google groups similar failing URLs, which helps you spot template-level problems.
- Test your money pages
Run PageSpeed Insights for the homepage, main service page, contact page, and best lead-generating blog.
- Record the LCP element
PageSpeed Insights often names the exact image or text block causing the delay. Save it.
- Check scripts in DevTools
Chrome DevTools shows which scripts block the main thread and how long they take.
- Compare against competitors
Test two or three nearby firms. If they are all red and you reach green, speed becomes a quiet advantage.
A local SEO audit checklist should include this process. Page speed, rankings, and conversion rate live closer together than most reports admit.
Now,
Run each test more than once. One PageSpeed run can be noisy. Three runs show the pattern.
Fix the WordPress Issues That Usually Fail Core Web Vitals
The fastest Core Web Vitals fixes usually target LCP first, INP second, and CLS third. On WordPress sites, the most common problems are oversized hero media, render-blocking CSS, heavy third-party JavaScript, slow server response, and missing image dimensions.
Use the failing metric to choose the fix.
| Failing metric | What to check first | Practical fix |
| LCP | Hero image and server response | Compress, convert to WebP or AVIF, preload the hero |
| INP | Chat, forms, booking widgets, page builder scripts | Defer scripts and remove unused plugin load |
| CLS | Images, embeds, banners, font swaps | Add dimensions and reserve space |
| TTFB | Hosting and caching | Move to better hosting or add full-page cache |
Do not start by installing three caching plugins. That usually makes the stack harder to debug.
For LCP, check whether the hero image is lazy-loaded. It should not be. The browser needs that image early, not after it waits. For INP, inspect anything that loads before the first click. Calendly, chat widgets, heatmaps, and old ad pixels are frequent offenders.
For CLS, the fix is less glamorous. Add width and height to images. Reserve banner space. Stop injecting content above the fold after the page has already started rendering.
Performance also affects how content gets reused in AI search. Fast, stable pages support the technical trust layer behind AI overviews changing search, especially when several local competitors answer the same query with similar depth.
What Should You Fix First?
Fix the pages closest to revenue before working across the whole site. A homepage score matters, but a slow contact page, booking page, or high-intent service page costs more. Prioritize fixes by business value and failed Core Web Vital, then roll template fixes across related pages.
Use a simple order:
- Fix the top lead page with the worst mobile field data.
- Resolve LCP if the main content appears late.
- Resolve INP if buttons, forms, or menus feel delayed.
- Clean up CLS if the page jumps while loading.
- Apply template fixes to similar pages.
A strong generative engine optimization strategy still needs a fast site underneath it. AI visibility, local rankings, and lead generation all suffer when the page frustrates visitors before they convert.
If your Google Page Speed Insights & Core Web Vitals Analysis shows red mobile scores and you cannot tell whether the issue is hosting, theme code, plugins, or images, the next step is a focused diagnosis. Which page is costing you the most qualified leads right now? and we will map the fix sequence for your highest-value URLs first.
What You Should be Doing Now?
Page speed work compounds. The team that fixes their LCP this quarter sees the field data improve over the next 28 days, the Search Console pass rate climb the month after, and the ranking lift register 2 to 3 months in. Teams that defer it lose ground every week to competitors who didn't.
Page experience signals will keep tightening, especially as AI Overviews shape local search and AI systems weight user experience more heavily when picking which sources to cite.
The three Core Web Vitals today will likely be four or five within a couple of years, and sites that built clean technical foundations now will absorb future changes far more easily than the ones still patching workaround caching plugins on top of bloated themes. User experience keeps moving, and AI now shapes how interfaces get designed. Our guide on how AI is reshaping UI/UX design covers where this is heading and what it means for your site.
If your firm's PageSpeed Insights score is dragging down lead flow, where exactly are you losing visitors? It might be slow LCP on the homepage, INP failures on form pages, or CLS shifts on mobile that frustrate visitors before they convert. Contact us and we'll run a complete Core Web Vitals diagnosis on your top revenue-driving pages and tell you exactly what to fix first.
FAQs
How often should a service business review PageSpeed data?
Quarterly is enough for stable sites. Monthly is better during redesigns, migrations, or plugin-heavy growth. We usually pair PageSpeed checks with Search Console and conversion data so teams can see whether speed changes affect calls, forms, and booked consultations.
Is a 100 PageSpeed score worth chasing?
Almost never. Past 90, the extra work often brings small gains. Spend that time fixing the next revenue page below 50 on mobile. We have seen more business impact from moving one contact page out of red than polishing a homepage from 96 to 100.
Can Cloudflare fix Core Web Vitals by itself?
Cloudflare can help TTFB and asset delivery, especially for multi-state firms. It will not fix a lazy-loaded hero image, missing dimensions, or a heavy booking script. Treat it as part of the stack, then still inspect LCP, INP, and CLS directly.
Who should own Core Web Vitals work?
Marketing should own the business priority. Development should own the technical fix. Problems start when nobody connects the two. A shared dashboard with PageSpeed, Search Console, and lead data keeps both sides focused on pages that affect revenue.
Should speed fixes happen before a redesign?
Often, yes. A quick technical pass can reveal whether the current theme is worth saving. If Elementor, old plugins, and slow hosting are the real issue, the redesign brief should specify a lighter build rather than repeating the same performance problems.