
The report lands as a PDF with a number on the front. Your site scores 62 out of 100. Below it sits a red band, a list of 340 issues, and a quote for fixing them.
Nobody in the room can say whether 62 is bad.
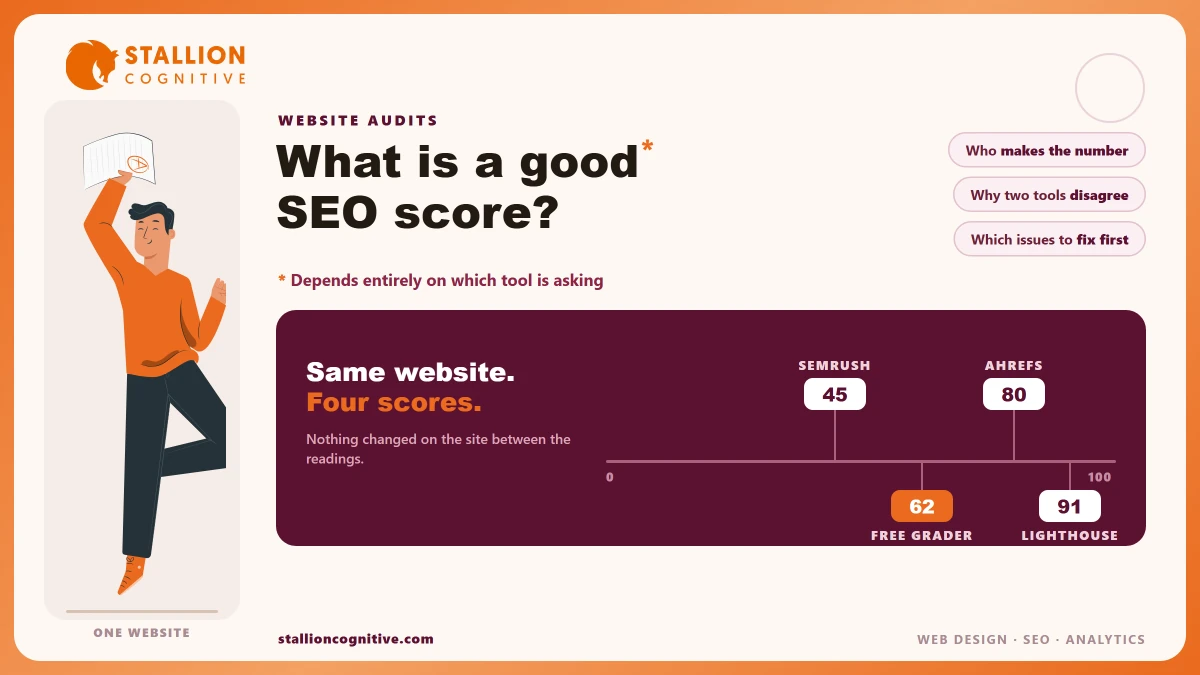
That is a fair question with an awkward answer, because the number came from a tool that invented its own scale. Swap the tool and the same website scores differently, on the same day, with the same pages. So the useful question is not what a good score looks like. It is which parts of that report describe a real problem.
What Is an SEO Score, and Who Makes It?
A tool crawls your site, counts the faults it knows how to look for, and turns that count into a percentage. The percentage belongs to the tool.
Google issues nothing of the kind. Search Console reports clicks, impressions, position and coverage, with no grade anywhere in it. So the score on your report was written by the company that sold the audit.
- Site auditors: Ahrefs and Semrush both crawl your pages and grade the faults they find.
- Speed tools: Lighthouse and PageSpeed Insights score how fast one page loads.
- Free graders: A form on an agency site that checks a handful of tags and emails you a number.
- Agency dashboards: Often one of the above, relabelled with the agency's logo on top.
The fourth kind deserves suspicion. A number with no published formula cannot be checked, argued with, or compared to anything.
Ask which tool produced the figure before you discuss the figure. That one question changes most of these conversations, and it takes about four seconds.
Why the Same Website Scores 80 in One Tool and 45 in Another
Both companies publish their maths, and the two methods disagree at the root. Read them side by side and the gap stops being a mystery.
Ahrefs keeps it simple. Its Health Score takes the internal URLs with no error issues, divides by all internal URLs, and multiplies by 100. Warning and notice issues "do not affect Site Audit health score at all."
Ahrefs gives its own worked example. A ten-page site with two faulty pages scores 80%. A hundred-page site with eighty faulty pages scores 20%.
Semrush counts a different thing. Its Site Health Score weighs errors and warnings against the number of checks performed, with errors weighted heavier, and the variety of problems pushes the score down as much as the volume does.
Then comes the line that breaks any comparison between the two. Semrush says its score "doesn't depend on the number of pages crawled on the site."
| Score | What the number counts | What it ignores | Does page count change it |
|---|---|---|---|
| Ahrefs Health Score | Share of crawled internal URLs carrying no error | Warnings and notices, in full | Yes, the whole score is a page ratio |
| Semrush Site Health | Errors and warnings against the checks it ran | Little, and variety counts against you | No, Semrush says it does not |
| Google Lighthouse | Five lab speed metrics, weighted | Content, links, indexing | No, it grades one page at a time |
| A free grader | Whatever its owner picked, usually page tags | Undisclosed | Unknown |
The split follows from the rules once you know them. A site with one broken pattern repeated over 400 pages looks dreadful to Ahrefs and tolerable to Semrush, because the ratio of bad pages to good ones is the whole of what Ahrefs counts. A site with fifteen different small faults spread thinly looks fine to Ahrefs and poor to Semrush.
Neither tool is wrong. They are answering questions you did not know you were asking, and the answer that suits your site depends on whether your faults are deep or wide.
The Practical Test
Pull both scores for the same site in the same week. A wide gap tells you your faults repeat across templates. A narrow gap tells you they are scattered, which is slower to fix and usually less damaging.
What Does Google's Own Score Actually Measure?
Google grades speed and nothing else. The Lighthouse performance score is the only number in this article that comes from Google, and it covers one page, on one run, under simulated conditions.
The weights are published. Google's own performance scoring documentation sets them out.
- Total Blocking Time: 30%, the largest single share.
- Largest Contentful Paint: 25%.
- Cumulative Layout Shift: 25%.
- First Contentful Paint: 10%.
- Speed Index: 10%.
Two caveats sit in the same document, and both get skipped in reporting. The weights "have changed over time" as the Lighthouse team keeps researching what people actually feel, so a score from last year and a score from this one are not the same measurement.
The second caveat is blunter. Google advises you to "think of your site performance as a distribution of scores, rather than a single number," because scores move with ad serving, network routing, the test device and any extension injecting scripts.
So a jump from 71 to 64 across two runs may be noise. Chasing it is how a retainer disappears into rerunning a test.
What Lighthouse cannot see is the rest of your site. Speed on the home page tells you nothing about whether your service pages are indexed, and lab numbers differ from what your real visitors get, which is why Core Web Vitals field data matters more than the score above it.
So What Counts as a Good Score?
Above 90 is healthy, 70 to 90 is normal for a working site, and under 50 usually means something structural. Hold those bands loosely. The tool sets them, and the tools do not agree with each other about where the lines should fall.
The pages ranking for this exact question prove the point on their own. Search it and you get "80 to 100", "70 and above", and a fourth site splitting 91 to 100 as excellent. All three describe a different scale.
- Above 90: Fine. Stop optimising the number and go find keywords.
- 70 to 90: Where most decent sites sit, including sites ranking well.
- 50 to 70: Worth a look, though usually for a handful of repeated faults.
- Under 50: Something is broken at template level, and it deserves real work.
A perfect 100 is a warning sign of its own.
It usually means the crawl was shallow, the settings excluded most checks, or somebody fixed alt text on 900 images while the service pages stayed out of the index. Depth of crawl changes the score more than quality of site does, which is why the crawl settings belong in the conversation before the number does.
Your ranking positions and enquiry count are the scoreboard. A score is a to-do list with a percentage printed on it, and the percentage is the least useful part.
How Do You Read the Audit Report Someone Just Sent You?
Skip the cover page. The number there is a sales device, and every real finding is further in.
Work through it in this order.
- Find the tool and the crawl date. A six-week-old crawl of 200 pages on a 3,000-page site is not a site audit.
- Read the error list only. Ignore warnings and notices on the first pass, since they are where the count gets padded.
- Check which pages carry each error. One error on your main service page outranks forty on old blog posts.
- Count the distinct causes. 340 issues often trace to four template faults.
- Ask what changes if it is fixed. A fault with no answer to that question is filler.
- Compare against the last report. Direction beats absolute value every time.
Step four is where most reports collapse. A theme injecting an empty heading into every page produces one fault reported 900 times, and a quote priced per issue counts it 900 times too.
Watch for a report that leads with volume and never names a page. Vague issue counts, no page-level detail, and a fixed monthly figure to resolve them are on the standing list of SEO agency red flags for a reason.
There is a fair version of the same document. It names the pages, groups faults by cause, says which ones affect money pages, and states what it expects to change, which is what a proper website audit is supposed to produce.
Which Issues to Fix First, and Which to Leave Alone
Sort by what it costs you rather than by what the tool flagged in red. Some faults block rankings outright, some cost clicks, and a fair number of them cost nothing at all.
| Issue | Why it lands there | Moves the score | Moves rankings |
|---|---|---|---|
| Pages blocked from indexing | A page Google cannot see cannot rank | Yes | Yes |
| Broken links on service pages | Dead ends where the money is | Yes | Yes |
| Missing or duplicated title tags | Cheap to fix, drives the click | Yes | Often |
| Slow loading on key templates | A real cost to real visitors | Yes | Sometimes |
| Thin-content warnings | A word count is not a quality measure | Yes | Rarely |
| Missing alt text on decorative images | Accessibility housekeeping | Yes | No |
| More than one H1 on a page | Tool convention rather than a Google rule | Yes | No |
The bottom three rows are where audit budgets go to die. Every one of them raises the score, so a report measured by score improvement will always drift toward them, and none of them will bring you an enquiry.
Fix the top two rows this month. Fix rows three and four next quarter, alongside whatever your on-page SEO checklist says about the pages that earn.
Leave the bottom rows for whoever is next in the file. Are you paying for ranking improvement or for a nicer number on a PDF?
A different measure sits outside all of this. Nothing in a site audit reports your website authority, and a site can be technically spotless while remaining invisible because no one has ever linked to it.
Where This Leaves You
A score is a tool's opinion of your site, computed by a formula that tool chose, and it moves when the tool changes its mind. Ahrefs and Semrush both publish their workings, both are reasonable, and neither can be compared to the other.
These are the habits worth keeping.
- Name the tool first: A number with no formula behind it cannot be discussed sensibly.
- Read errors, then pages: Where a fault sits decides whether it costs you anything.
- Track the direction of travel: Last quarter against this one beats any single reading.
Say a report arrived this week and you cannot tell which of its 340 issues are real. That is a short piece of work with a definite answer, and we read these reports for financial and professional firms most months, usually finding four or five causes behind the whole list. Have the report reviewed before you approve the quote attached to it, and check first what SEO costs a firm your size before committing to a retainer.
Frequently Asked Questions
How often should we re-run the audit?
Quarterly suits most firms, with an extra crawl after a redesign or a migration. Monthly is too often on a stable site, since most of what it turns up is movement to talk about rather than anything new. Keep the crawl depth identical each time.
Can the score drop after we fix things?
It happens often. Fixing indexing lets the crawler reach pages it never saw, so new faults appear and the ratio worsens while the site improves. Judge the change by which pages are now indexed.
Are free SEO checkers worth running at all?
They make a rough starting point and little more. Most read a handful of page tags on one URL, then present the verdict as if it covered your whole site.
Should the score go in our monthly board report?
Better left out. Rankings for named terms, organic enquiries and indexed page counts all answer questions a board actually has. A vendor percentage invites a discussion nobody can settle.
Does a competitor's score tell us anything?
Very little, and it is easy to over-read. Competitors outranking you with worse scores is the normal state, because links, content depth and search intent decide far more than crawl hygiene does.