
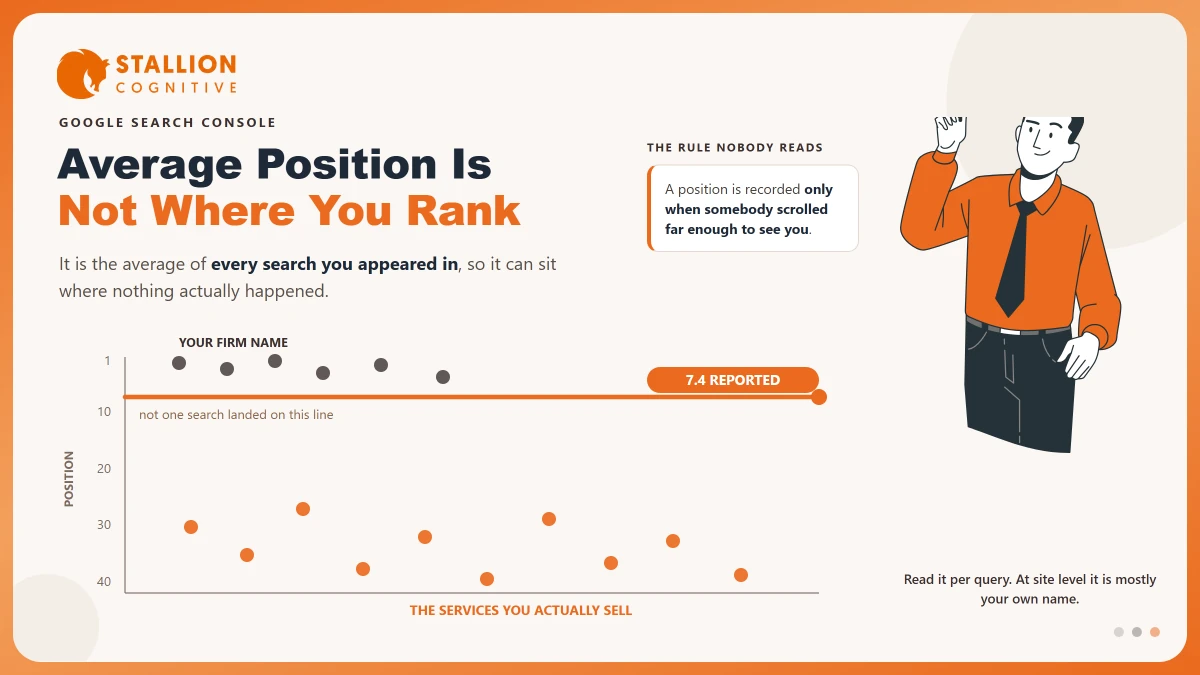
Your report says 7.4. You type the service you sell into Google, scroll, and find your firm near the bottom of page two. Nothing is broken here, and neither number is lying to you.
They measure two different things, and Google says so plainly in its own help pages, which is the part most owners never get around to reading.
Average position is the one figure owners quote in meetings and almost nobody reads well. It looks like a rank, because it is a small number sitting next to your website. It behaves like an average, because that is what it is. Averages hide the exact detail you need when you are deciding where to spend money.
What follows is what Google records, why it disagrees with your own search, and the one counting rule that changes how you read the whole report.
What Does Average Position Actually Measure?
Google's definition is short and does most of the work. The Search Console documentation says the position value "is the topmost position occupied by a link to your property or page in search results, averaged across all queries."
Two words in that sentence carry the weight.
- Topmost: If three of your pages show up for one search, Google records the best of the three and drops the rest. A firm with a service page at 4 and a blog post at 26 is logged at 4. The blog post adds nothing to the number, so a page can be failing while the report looks healthy.
- Averaged: Your site-level figure blends every query you appeared for. Your firm name, which you rank first for because nobody else is called that, sits in the same average as the service term you are trying to win.
Brand searches are usually the biggest single group a small firm gets, and they all score 1.
So a firm with a strong name and weak service rankings gets a flattering site-level average almost by default. The number climbs when people look for you by name. That is the one case where ranking was never in doubt.
Google is blunt about the risk. The same page calls position "a complex metric that can be misleading if you don't understand the subtleties." That is unusual wording for a help document, and it is the reason this article exists.
Why Does Your Own Search Never Match the Report?
Google answers this complaint directly. Its help page carries a heading about a page showing position 5 in the report and position 8 when the owner searches for it, and the reply is plain:
"Position value is the average position for all searches. For your specific search your position might be different than the average because of many variables, such as your search history, location, and so on."
Your own search is one data point out of thousands, and it is the least typical one you could pick. You have looked up your own firm name hundreds of times. You are sitting in your own office, on a network your clients never touch, signed in to an account that has clicked your website more than anyone else's.
There is a second cost to checking by hand, and it is larger than people expect. Every result you skip teaches Google something. Every result you click teaches it more. An owner who checks daily is running a small experiment on their own search history, then reading the result as though it were the market.
The same forces decide whether a listing shows when a client across town searches, which matters if your firm leans on map results and yours is not showing up on Google.
The report is flawed, and it is still the only view of your rankings that was not built out of your own browsing. Checking by hand feels like proof and works like noise.
A Position Counts Only If Someone Scrolled Far Enough to See You
Here is the rule that changes everything else, and almost no explainer mentions it. Google records a position only when an impression happens:
"A link must get an impression for its position to be recorded. If a result does not get an impression, for example, if the result is on page 3 of search results, but the user only views page 1, then its position is not recorded for that query."
Read that against how people search. Most searchers never reach page two. So if your page sits at 28 for a term, it earns a recorded position only when somebody scrolled all the way down to it. Everyone else searched, saw ten other firms, left, and none of that counts against you.
The result is uncomfortable. Your average position comes from a narrow group of people, the ones who kept scrolling until they reached you. Everybody who gave up earlier is simply absent from it. Those patient few are the least like the client you actually want.
A page buried at 30 is scored only by the handful of people willing to dig that far. The average that comes back describes those people and says very little about how visible you are.
Google makes the same point inside the report. Where no position exists you see a dash, which the help page explains as "there is no recorded position because the user never saw your property for that query."
So a report with no terrible positions in it can still belong to a site with terrible rankings. The worst of them were never written down.
When a Rising Average Position Is Bad News
Follow that rule one step further and you reach the trap that catches owners in quarterly reviews.
Say your firm ranked around 40 for a dozen competitive service terms, and now and then somebody dug far enough to see one of them, which fed a weak position into your average. Then the site slips. It stops showing for those terms at all, and because no impressions means no recorded positions, those twelve drags simply drop out of the sum Google reports back to you.
The average on your report improves in the very month the visibility behind it fell away.
The reverse trips up good work. A firm that starts publishing properly begins to show for terms it never touched, usually near the bottom of page two, because that is where new pages land. Each one is a real gain in reach. Each one pulls the average down.
The report shows a decline in the month the site got better.
| What you see | What owners assume | What it can also mean |
|---|---|---|
| Average position improves | Rankings went up | You stopped appearing for terms you ranked badly on |
| Average position falls | Rankings went down | You started appearing for new terms all of them low |
| Average position is flat | Nothing changed | Gains and losses cancelled out inside the average |
| Position shows a dash | Data is missing | Nobody scrolled far enough to see you at all |
So stop reading position on its own. Put impressions beside it every time. Impressions tell you how much ground you cover, and position tells you where you sit on the ground you cover. If your numbers moved and you want the fuller check, the reasons traffic dropped are worth working through in order.
What Is a Good Average Position for a Firm Like Yours?
The honest answer is that a site-level average is not a target worth setting. It mixes brand terms with service terms, and it moves for reasons that have nothing to do with how well you are doing.
At query level the number turns useful, because one query is one intent.
| Average position for one query | What it usually means | Where the effort goes |
|---|---|---|
| 1 to 3 | You hold the visible top of the page for that term | Protect it and check the title still earns the click |
| 4 to 10 | You are on page one and being skipped | Title and description work before any new content |
| 11 to 20 | Close and the cheapest gains on the whole report | Strengthen the existing page before writing a new one |
| 21 and beyond | Not competing yet for that term | Decide whether the term is worth the investment at all |
The 11 to 20 band is where the money usually sits. Those pages already rank, Google already understands them, and lifting one onto page one is a smaller job than starting from nothing. The same logic sits behind a good SEO score, where the useful reading is always a specific number on a specific page.
One warning before you sort by position and start at the top. A query at position 3 with four impressions a month is not a win. A query at 14 with 900 impressions is not a failure. Sort by impressions first, then read position inside that.
The Two Averages You Cannot Add Together
Search Console groups data two different ways, and the two do not mix. Google spells this out on the Performance report page: "Data grouped by Queries, Countries, Devices, or Dates is aggregated by property. Data grouped by Pages or Search appearance is aggregated by page."
The same page warns about the symptom you will see. "The chart totals can sometimes differ from the table totals. This is usually due to differences in aggregation (property vs. page)."
That split changes what the table can safely be used for.
- Do not average a column of averages: Each row covers a different number of impressions, so treating them as equal weights a rare query the same as a busy one. The site figure Google gives you is already weighted properly.
- Do not compare a page figure to a property figure: They were worked out by different rules, so a gap between them is arithmetic and not a finding.
- Does the query set look the same as last month? A different mix of queries makes a different average even when every ranking held still.
Two pages chasing one term does real damage here, because Google logs only the topmost of them, so the weaker page goes invisible in your reporting while it carries on splitting your relevance. Worth checking if you suspect you have two pages competing for one search.
How Should You Read the Report on Monday?
A useful read takes about fifteen minutes and needs nothing beyond Search Console itself, which stays free for any verified site.
- Open the Performance report, set the range to the last 28 days, and compare it with the previous 28.
- Filter out your firm name. What is left is people who did not already know you.
- Sort the query table by impressions, highest first, and read the top twenty rows.
- Write down every query between position 11 and 20 with real impressions behind it. That is your work list.
- For each one, open the page Google already ranks and improve that page. Do not write a second page on the topic.
- Check back after six weeks. Position data moves daily and means nothing at that resolution.
A monthly note needs total impressions and position for your three most valuable queries, and nothing else on that screen has earned a line yet.
If you want the wider picture of which tool answers which question, the split between Search Console and Analytics settles most of it. The broader question of whether your website is working needs business numbers that Search Console was never built to hold.
What the Number Is Good For
Average position is a sound metric asked to do a job it was never built for. It describes where you showed up across a set of searches. Owners use it to answer whether they are winning, which is a question about one term, one page and one buyer.
Ask it the smaller question and it answers well.
- Which queries put us on page one but outside the top three? Those are title and snippet problems, and they are cheap to fix.
- Which pages sit at 12 and could sit at 6? That is your work list for the quarter.
- Which terms do we show for now that we did not show for in spring? That is reach, and it is the number a content programme should move first.
If your report shows respectable positions and the phone stays quiet, the gap is usually between the terms you rank for and the terms your clients type. That is a research problem before it is a ranking problem, and it is the first thing we look at in a free SEO audit.
Frequently Asked Questions
Why does Search Console show a different position from my rank tracking tool?
Rank trackers query from a fixed location on a clean browser, so they measure a staged search. Search Console averages thousands of real ones across every location, device and search history you appeared in, which is why the two figures rarely agree.
Does scrolling to find my own site hurt my average position?
Your ranking takes no damage from it. The scroll does add an impression at a deep position and a little noise to your own data, and on a firm with low search volume, repeated self-checks show up in the numbers.
Why is my average position better on mobile than desktop?
The two show different numbers of results and different features above them, so one ranking sits at a different position on each. Filter by device before comparing, because the blended figure hides the gap entirely.
How far back does position data go?
Search Console holds 16 months. Anything older must be exported before it ages out.
Can you see position for a single town or city?
Only down to country level in the standard report. There is no city filter, so local visibility has to be judged from Business Profile data and from enquiries instead.