
Most owners judge a website the way they judge a storefront. The photos load, the phone number is right, nothing looks broken, so it must be earning its keep.
Then the quarter closes. Nobody can say what the site actually produced.
Knowing if your website is working comes down to six numbers you can pull in about ten minutes. This post walks through each one, gives you the range we consider healthy for a service business, and points you to the exact tool it lives in. You will also get the part that almost every article on this topic skips, which is how long to wait before any of those numbers deserve your trust.
Let's start with what "working" has to mean.
What does it mean for a website to be working?
Your website is working when it turns the right visitors into conversations your team can act on, at a cost you would pay again. That is the whole test. Design quality, traffic volume, and time on page are inputs that feed the test. None of them pass it alone.
The output is a named human being asking for your help.
So the question "is my website working for my business" splits into two smaller ones.
- The input side: How many of the right people arrive, and what you spend to bring them there.
- The output side: How many of them start a conversation, and how many of those turn into signed work.
Answer both with a real number this month and your website is measurable. Answer only the first and you have a reporting problem sitting on top of whatever else is wrong.
Owners drift toward the input side because inputs are visible. You can look at a homepage and form an opinion in four seconds. A climbing traffic line feels like progress. What you cannot see is whether any of that movement reached somebody with a budget.
That gap is normal. HubSpot's 2026 State of Marketing report surveyed more than 1,500 marketers and found measuring ROI at the top of the challenge list at 33%, ahead of trends, lead generation, and sales alignment. If full-time marketers struggle to tie activity to revenue, an owner checking in between client calls has no chance without a system.
Which six numbers tell you if your website is working?
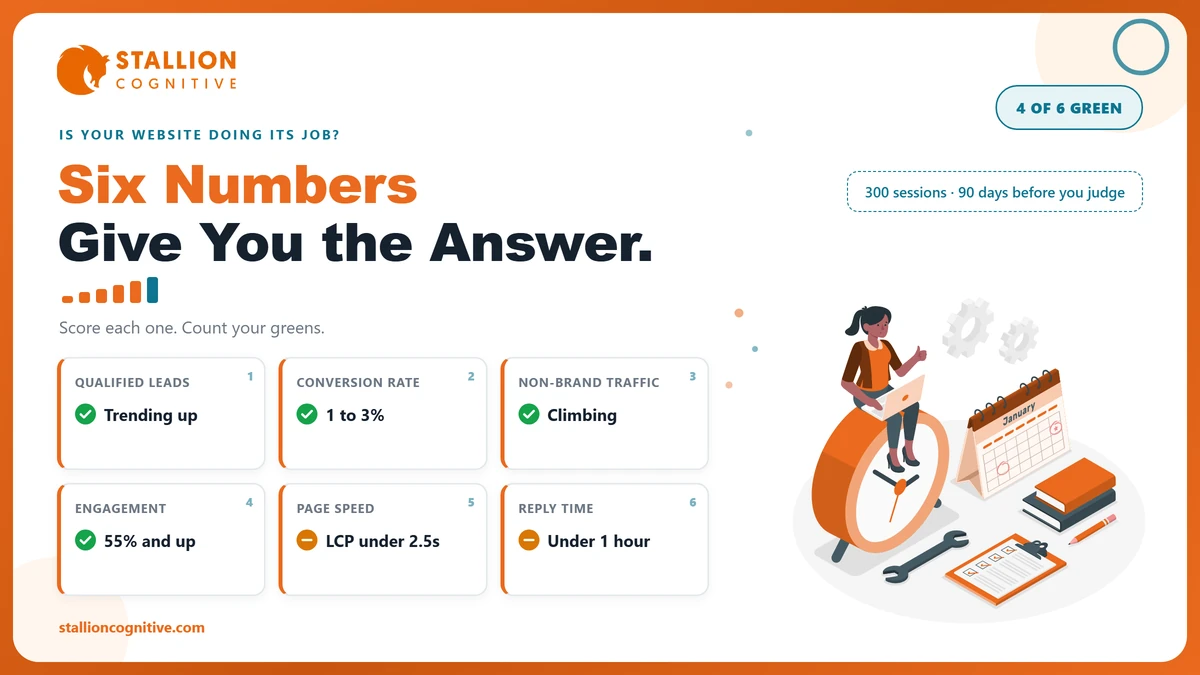
Six numbers cover it. Qualified leads per month, conversion rate, non-brand organic sessions, engagement rate, Core Web Vitals, and lead response time. Three of them measure business results. The other three measure the machinery underneath. Together they are the shortest honest answer to how to tell if your website is working.
Print this table. It is the scorecard.
| # | Number | What healthy looks like on a service site | Where it lives |
|---|---|---|---|
| 1 | Qualified leads per month | You can name last month's figure, and the trend rises quarter over quarter | Your CRM, or a tagged inbox |
| 2 | Conversion rate | 1% to 3% of sessions start an inquiry judged against your own trailing average | GA4 key events |
| 3 | Non-brand organic sessions | Climbing while branded search stays flat | Search Console, brand terms filtered out |
| 4 | Engagement rate | 55% and up on the pages that sell | GA4 |
| 5 | Core Web Vitals | LCP under 2.5s, INP under 200ms, CLS under 0.1 | Search Console, or PageSpeed Insights |
| 6 | Lead response time | Under one hour during business hours | CRM timestamps, or a manual test |
How to read it without spiraling. Score each row green, amber, or red, then count.
- Four or more greens means the site is working, so your job is finding gains rather than running a rescue.
- Two or fewer greens means something structural is broken, and the rest of this post helps you find which layer.
- One red row surrounded by greens is a targeted fix, and it is usually the cheapest work you will ever buy.
Notice what the scorecard leaves out. No page views, no follower counts, no keyword rankings on their own, no "we hit page one for our own company name." Those numbers move without your business changing, which makes them poor evidence in either direction.
How do you read the three business numbers?
These three tell you whether the website earns money. Read them first, because a site can fail every technical check and still print revenue, and it can pass every technical check while producing nothing at all. Start with the numbers your accountant would recognize.
The three business numbers are qualified leads, conversion rate, and non-brand organic sessions.
Qualified leads, counted properly
A form submission is not a lead. Count them as leads and you will hand yourself a flattering number that falls apart the moment sales looks at it.
We audited an accounting firm's site last year that reported 41 form submissions in a month. Eleven were prospects. The rest were staffing agencies, a software vendor, two job applicants, and a bot filling the same field with Cyrillic text.
Sort every inquiry into one of these buckets at intake, and do it the day it arrives rather than at quarter end.
- Real prospect who fits the work you want
- Real prospect who does not fit, which is a positioning signal worth its own conversation
- Existing client using the contact form as support
- Recruiter, vendor, or partnership pitch
- Spam
Only the first bucket belongs in your headline number. If that bucket sits near zero while traffic looks fine, the problem sits downstream of the visit. The reasons a website isn't getting leads usually cluster in the offer, the form, or the follow-up.
Conversion rate, and why borrowed benchmarks mislead
Divide qualified leads by sessions for the same period, then multiply by 100.
- Count only the leads from the first bucket above.
- Divide that by total sessions for the same month, then log the result and keep a rolling twelve-month record.
Here is where most owners go wrong. They search for a website conversion rate benchmark, find an ecommerce figure, and panic.
Statista puts the global ecommerce conversion rate at 1.4% for the first quarter of 2026, with skincare near 2.7% and luxury apparel at 0.4%. Those numbers describe somebody clicking "buy" on a $40 product in one sitting. Your visitor is weighing a $12,000 engagement, three internal approvals, and a two-month decision. The two behaviors have little in common.
Across service-business client work we treat 1% to 3% as the healthy band. Your own trailing average still rules. A firm moving from 0.6% to 1.4% is winning, even though 1.4% looks dull on a chart.
Two levers move this figure faster than anything else. Clarify what happens after somebody reaches out, because vagueness at that moment kills more inquiries than weak design does. Then cut the effort your form demands, since multi-step forms beat a single wall of fields, and a high-converting website is mostly a series of small frictions removed.
Non-brand organic sessions
Filter your own company name out of Search Console before you read any traffic number. Branded search measures the awareness your sales team, referrals, and past clients already built. It tells you nothing about whether the website is finding you new people.
Three steps in the Search Console performance report get you there.
- Open the performance report and set the date range to the last three months.
- Add a query filter, choose "doesn't contain," and enter your brand name and its common misspellings.
- Compare that filtered total to the same period last year.
Rising non-brand sessions mean the site is reaching strangers. Flat non-brand sessions with rising branded search mean your reputation is growing and your website is coasting on it.
When the line falls instead, resist the urge to rebuild. Diagnose it, because the reasons behind a website traffic drop range from a core update to a botched migration to a single noindex tag, and each one has a different fix. One more wrinkle has appeared in the last two years. Visitors arriving from AI answers often show up misattributed, or invisible, in default reports. So it pays to track AI traffic in GA4 as its own channel before you conclude anything vanished.
How do you read the three health numbers?
The health numbers explain why the business numbers look the way they do. They rarely make your quarter on their own, and they quietly cap everything else when they slip. Owners tend to skip them because they feel technical, yet each one takes under two minutes to check.
- Engagement rate and Core Web Vitals tell you whether people can use the site once they land.
- Lead response time tells you whether the work the site did survives contact with your team.
Engagement rate
GA4 defines an engaged session with three conditions, and a session qualifies by meeting any one of them. Google's documentation on engaged sessions lists them plainly.
- Duration: The session lasts 10 seconds or longer.
- Depth: The session includes 2 or more page or screen views.
- Action: The session includes at least 1 key event.
Bounce rate is simply the inverse of that figure now, which is worth knowing if you still have a report quoting the old metric. On the money pages that carry your offer we want to see engagement rate at 55% or better. Below 40%, something is misfiring in the first screen. It is usually a headline that describes your company instead of the visitor's problem.
Check it page by page. A site-wide average hides the one page doing the damage.
Core Web Vitals
Google Search Central publishes exact thresholds for Core Web Vitals, so this row of the scorecard needs no interpretation at all.
- LCP: The main content should render within 2.5 seconds of the page starting to load.
- INP: Responses to interaction should land in under 200 milliseconds.
- CLS: Layout shift should stay below 0.1.
Fail these and you are paying for visitors who leave before your argument begins. We have watched a firm lose a quarter of its mobile sessions to a single uncompressed hero image, and the fix took an afternoon. If your numbers sit in the red, the money leak from a slow website is measurable long before Google reacts to it.
Lead response time
Your website can do everything right and still show a terrible return, because the inquiry it produced sat in an inbox until Tuesday.
Test this yourself rather than trusting the process on paper. Submit your own form on a Thursday afternoon, using a personal email address nobody on the team recognizes, then time the reply.
Four things to check while you are in there.
- Does the notification reach a person, or an unmonitored shared mailbox?
- Does the auto-reply say what happens next and when?
- Are phone inquiries logged anywhere, or do they vanish into a mobile call history?
- Does anybody own the follow-up if the first reply gets no response?
We aim for a reply inside one business hour. Two days is common, and it quietly converts a working website into a leaky one.
How long before you can judge your website fairly?
Give it 300 sessions on the page you are judging and 90 days of history before you read anything into a conversion rate. Sample size is the reason. Below that threshold, a single extra inquiry swings the percentage enough to send you rebuilding a page that was fine. Measuring website results is a different habit from reacting to them.
We will not call a conversion rate at 120 sessions. The math is too thin to defend, and we say so even when a client would prefer a verdict that week.
Four rules keep the reading honest.
- Wait for 300 sessions before you calculate a rate on any single page.
- Read 90 days rather than 30, so one good week stops flattering you.
- Compare against the same quarter last year when you have the data, because seasonality is real and January does not resemble August for most firms.
- Change one thing at a time, then wait out the sample again.
A new site needs longer still. Fresh pages take weeks to index and months to earn stable positions. A three-month-old website producing few organic leads is behaving normally.
Does that feel slow? It is, and the alternative is worse. Owners who judge on 30 days spend the year reversing decisions.
What if the numbers look bad but the website is fine?
Sometimes every red row on the scorecard traces back to something the website never controlled. Ruling these out first saves you from paying to fix the wrong layer, which is the most expensive mistake in this entire process.
Five causes account for nearly all of it.
- Wrong visitors: You rank for terms that attract people who will never buy. The conversion rate is accurate and the traffic is worthless.
- Unclear offer: The site explains services without telling anyone what starting looks like, what it costs, or who it suits.
- Nobody follows up, so the leads exist and die in an inbox.
- Broken tracking: A duplicate GA4 tag, a form that redirects before the event fires, or a consent banner blocking measurement. The number is wrong while the site works fine.
- Your sales cycle runs longer than your reporting window. A six-month pipeline looks like failure in a monthly report.
Broken tracking deserves particular suspicion, because it is common and it looks exactly like poor performance. Before accepting any red row, submit a test inquiry and confirm the key event appears in GA4 within a few minutes.
When do the numbers say rebuild instead of tweak?
Rebuild when the structure blocks the fix, and tweak when the structure allows it. Most sites need the second thing and get sold the first.
| What the scorecard shows | The honest verdict |
|---|---|
| One or two red rows, clear causes | Targeted fixes, weeks of work |
| Strong traffic, weak conversion | Rework the offer and the pages that sell, keep the site |
| Every health row red, no clear owner | Technical rebuild of the foundation |
| Site cannot be edited without a developer for every change | Rebuild on something you control |
That last row decides more cases than performance ever does. When a small copy change needs a support ticket and a two-week queue, improvement stops being possible. No amount of measurement fixes a platform you cannot touch.
If the verdict points to a rebuild, get the budget conversation right early. Website redesign cost varies more by scope than by agency. And knowing how to choose a web design agency protects you from paying twice for the same site.
Your next ten minutes
Open Search Console and GA4, fill in the six rows, and write the date on the page. Next month you will have something almost no owner has, which is a second data point and a direction.
Then decide from evidence instead of vibes. That single habit changes what you buy, what you ignore, and how fast you catch the leak.
Want a second pair of eyes on the numbers before you spend anything? Our team will run the scorecard against your site and tell you which layer is actually costing you, starting with a free website audit.
Frequently asked questions
Do I need a paid analytics tool, or is GA4 enough?
GA4 and Search Console cover five of the six numbers at no cost. Paid tools add session recordings, which help once you know which page to investigate. Buy them second.
Why doesn't my analytics data match my hosting stats?
Server logs count every request, including bots, crawlers, uptime monitors, and AI agents. GA4 counts humans running JavaScript, minus anyone who blocks scripts or declines cookies. Both numbers can be correct at once. Pick one as your source of truth and stay with it.
Should I trust the score from a free website grader?
Grader tools read code, tags, and speed. None of them can see your CRM, so none of them know whether the site produces revenue. A green score on a page generating zero inquiries measures the wrong thing.
How far back can I look in GA4?
Standard GA4 properties retain event data for 14 months at most, and properties left on the shorter setting keep only two. Check that setting today, because the data you never retained cannot be recovered later. Export your monthly scorecard to a spreadsheet regardless.
My competitor's site looks better than mine. Does that mean mine is failing?
Design comparison reveals nothing about performance. Their prettier site may convert worse, load slower, and attract visitors who never buy. Compare your own trailing numbers month over month, because that is the only comparison where both sides are visible.